Bus factor is one of those concepts every engineering leader nods at and almost nobody measures.
The definition is simple: how many people would need to leave — or get hit by a bus — before your project is in serious trouble? A bus factor of 1 means a single person holds knowledge that no one else has. If they leave, you’re exposed.
Most teams estimate this. They name names. They have informal conversations about who knows which system. And then they file it away until someone actually leaves.
The problem isn’t awareness — it’s the lack of measurement. Informal knowledge about knowledge concentration is itself concentrated in the people who know the system well. By definition, it’s unreliable.
There’s a more direct method.
Why Git History Is the Right Source
Your version control system contains a complete record of who changed what, when, and how often. Every commit is a data point about knowledge ownership. Aggregate those data points per file and per module, and a picture emerges: some files have been touched by ten different developers over five years. Others have been touched almost exclusively by one person — hundreds of commits, no one else meaningfully involved.
This doesn’t require anyone to answer a survey. It doesn’t depend on organisational charts or team definitions being up to date. It reads what actually happened.
The resulting metric — often called silo ratio — measures the percentage of meaningful commits to a file or module made by the top contributor. A file where one developer made 95% of all commits has a silo ratio of 95%. That developer is the de facto sole owner, regardless of what any CODEOWNERS file says.
How to Calculate Bus Factor From Commits
The core calculation is straightforward:
For each file:
- Count total commits that changed this file
- Count commits per author
- Silo ratio = (commits by top author) / (total commits) × 100
For each module (group of related files):
- Aggregate commit counts across all files in the module
- Calculate the same ratio at module level
A silo ratio above 80% is a meaningful threshold. Above 95% and the module has effectively one owner — bus factor 1.
Secondary coverage adds a second lens: what percentage of files have a second contributor who made at least 10–15% of commits? Secondary coverage tells you how much of your codebase has genuine knowledge redundancy, as opposed to a primary owner with occasional reviewers.
What the Numbers Look Like in Practice
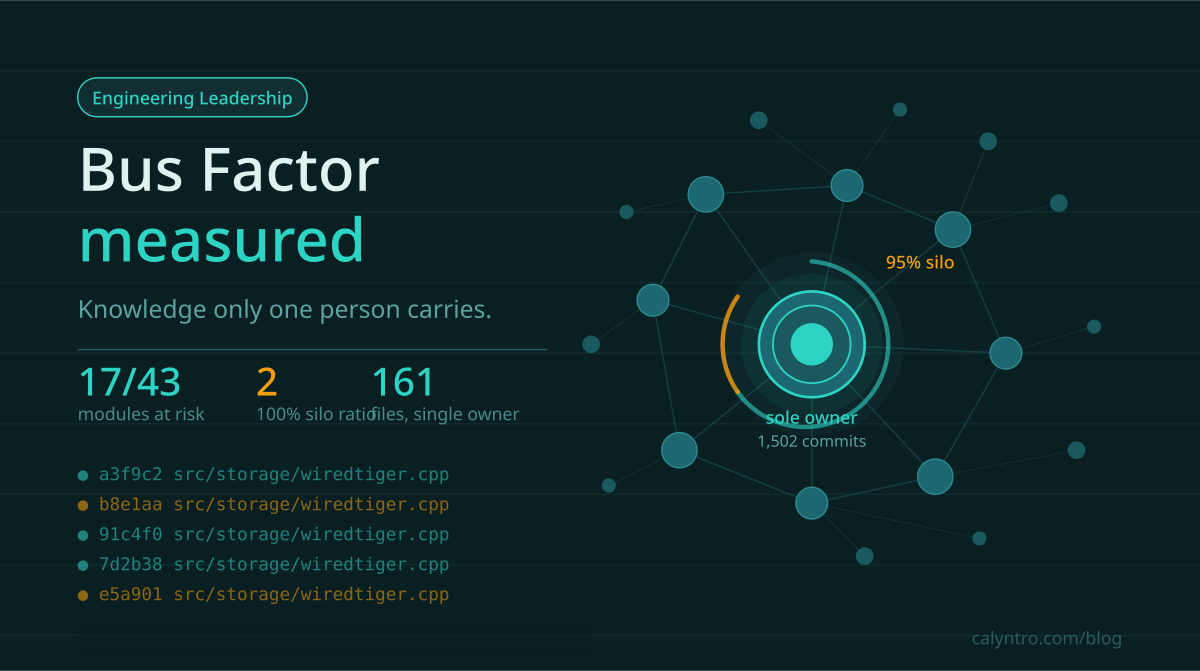
We ran this analysis on the MongoDB open-source repository — a large, professionally maintained codebase with roughly 500,000 commits across decades of history.
The results:
- 17 of 43 modules show measurable knowledge risk (silo ratio above threshold)
- 2 modules have 100% silo ratio — sole owner, no secondary coverage
- One developer holds exclusive knowledge of 161 files in a single module, with over 1,500 commits of accumulated activity
This is a well-maintained open-source project with a large contributor base. The same patterns appear in most production codebases — the difference is whether you can see them.
Interpreting the Results
A high silo ratio isn’t automatically a crisis. Context matters.
Questions to ask:
- Is the module actively changing, or stable? A siloed module that nobody touches is a lower risk than a siloed module at the centre of every sprint.
- Does the sole owner have any plans to leave? Knowledge risk is a probability problem. Bus factor 1 in a stable module with a long-tenured developer is different from bus factor 1 in a module undergoing active development with a contractor.
- What are the downstream dependencies? A siloed module that other teams depend on couples the risk across team boundaries.
That last point is important. Knowledge concentration and change coupling are often treated as separate concerns. They’re not. A module where one person holds all the knowledge — and that module changes regularly alongside modules owned by a different team — is not just a knowledge risk. It’s a coordination risk. Both amplify each other.
From Measurement to Action
Measurement without action is just a more detailed list of worries.
The useful output from bus factor analysis is not a ranking of modules by silo ratio. It’s a prioritised set of recommended actions, matched to the actual risk profile of each finding.
For a module with 100% silo ratio and no secondary coverage: → Schedule knowledge transfer sessions. Identify a secondary owner candidate. Make this explicit in the next planning cycle — not a background task.
For a module that’s siloed and actively changing: → Pair programming or joint code review is more effective than documentation. The goal is transferring tacit knowledge, not producing artefacts.
For a module that’s siloed and coupled to another team: → The coordination risk needs an explicit interface. If two teams regularly change code together and only one person understands the boundary, that’s where your next incident will originate.
Putting This Into Practice
The raw numbers are not the hard part. A few git log commands will get you commit counts per author per file. What you get from that is a first signal — and a long list of reasons why that signal alone is unreliable.
Author identity. The same developer commonly appears under two or three different Git identities — a work laptop, a personal machine, an old company email. Without identity resolution, ownership is split across phantoms. A module that looks shared may have a single owner you’re not recognising.
Commit noise. A mass reformatting run, a licence header update, or a dependency bump can touch hundreds of files in a single commit and dominate the history. Auto-generated files, build artefacts committed by CI, and bot accounts all introduce the same distortion. Unfiltered, these inflate the numbers without conveying any actual knowledge ownership.
Recency weighting. A developer who contributed heavily three years ago and left the team eighteen months ago still shows up in raw commit history. Their accumulated count may easily exceed that of the current primary owner. Without time-weighting, the signal points to people who aren’t there anymore.
Semantic weight. A five-line bugfix and a 600-line architectural change are both one commit. Commit count is a proxy; it needs to be combined with change volume to reflect where knowledge actually accumulated.
Change coupling across modules. Knowledge risk doesn’t exist in isolation. A siloed module that regularly changes in lockstep with modules owned by different teams compounds the risk across team boundaries. That coupling doesn’t surface from per-file commit statistics alone.
Trend over time. A one-time snapshot tells you where the risks are today. It doesn’t tell you whether concentration is increasing, whether a knowledge transfer programme is working, or where new silos are forming in recently added modules.
Getting from raw commit data to a reliable, actionable picture requires resolving all of these. It’s the difference between a number and an insight.
The Calyntro Knowledge Risk view handles this end to end — author identity resolution, noise filtering, recency weighting, silo ratio per module and file, secondary coverage, change coupling, and prioritised recommended actions. The live demo at demo.calyntro.com runs against the MongoDB repository and requires no login.
The Git history already knows where your bus factor risks are. The question is whether you’re reading it.
Calyntro is a self-hosted repository analytics platform. Your data never leaves your infrastructure. Contact us to run this analysis on your own codebase.