Conway’s Law was stated in 1967: any organization that designs a system will produce a design whose structure mirrors the organization’s communication structure.
Fifty-eight years later, it is still being treated as a principle to design toward — not a pattern to measure in what already exists.
That’s the gap we wanted to close.
From Metaphor to Measurement
The usual treatment of Conway’s Law goes like this: recognize that your teams' communication structure will shape your architecture, then design your teams deliberately to get the architecture you want (this is what Team Topologies calls “inverse Conway maneuver”). That’s sound advice.
But there’s a prior question that most teams skip: does your current architecture actually reflect how your teams communicate — or how you think they communicate?
The answer isn’t in your architecture diagrams. It’s in your Git history.
Every commit records what changed, when, and alongside what else. Over thousands of commits, the pattern of what changes together — across which boundaries — is a direct artifact of how your teams coordinate. Not the way it’s documented. Not the way it was designed. The way it actually happens, day by day, pull request by pull request.
That pattern is readable. And once you can read it, Conway’s Law stops being a metaphor and starts being a diagnostic.
How We Measure It
The core idea is simple: modules that change together, coordinate together. If two modules consistently appear in the same commits, there is an implicit coupling between the people maintaining them — whether that coupling is intentional or not.
Here’s the approach Calyntro uses:
Step 1: Co-change frequency
For each pair of modules (A, B), we count how often they appear in the same commit within a configurable time window. A high co-change frequency means the modules are coupled in practice, regardless of what the dependency graph says.
Step 2: Team ownership overlay
We map each module to its owning team and classify each co-changed pair: are both modules owned by the same team, or do they cross a team boundary? Cross-team co-changes are the Conway’s Law signal we’re looking for.
Step 3: Directionality
This is where it gets architecturally interesting. We don’t just ask whether A and B change together — we ask which one drives the other.
For each pair:
- Count commits where A changed and B followed within N days
- Count the reverse: B changed, A followed
- Compute a directionality ratio:
forward / (forward + reverse)0.5= symmetric1.0= A always drives B0.0= B always drives A
Symmetric coupling might be coincidental — two modules that happen to be touched in the same refactors. Asymmetric coupling is a structural signal. When A consistently triggers changes in B but not the reverse, there’s a real dependency going one way. Someone who touches A always has to think about B. The inverse isn’t true.
That kind of directional dependency usually means a hidden architectural decision that was never formally made — it just accumulated, commit by commit, until it became load-bearing.
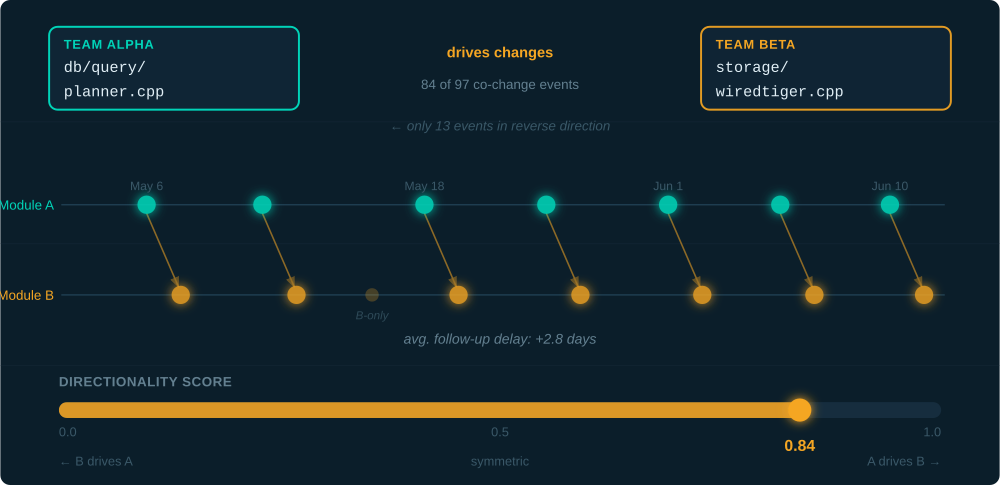
Every orange dot shows Module B following a change in Module A. The lone faint dot is a B-only change — the exception, not the rule. Directionality score: 0.84 (1.0 = A always drives B).
Step 4: Severity classification
We classify each cross-team coupling pair by severity:
- Isolated: occasional, low coupling score, may be coincidental
- Systemic: consistent pattern over time, high score, likely reflects real coordination cost
- Warrants API boundary: asymmetric, high-frequency, cross-team — the coupling is strong enough that the two modules probably need a formal interface between them
The MongoDB Experiment
To test whether this actually surfaces meaningful patterns, we ran the analysis on a real, large codebase: the MongoDB open-source repository.
⚠️ Important disclaimer: MongoDB is an open-source project with no official team structure. The team assignments we used are simulated — we constructed them to demonstrate what the analysis would show in a real organization. The Git history and the co-change patterns are real. The team boundaries are not.
This was a deliberate choice. We wanted to validate the measurement approach on a codebase large enough to produce statistically meaningful patterns, without misrepresenting any real organization’s structure.
What we found:
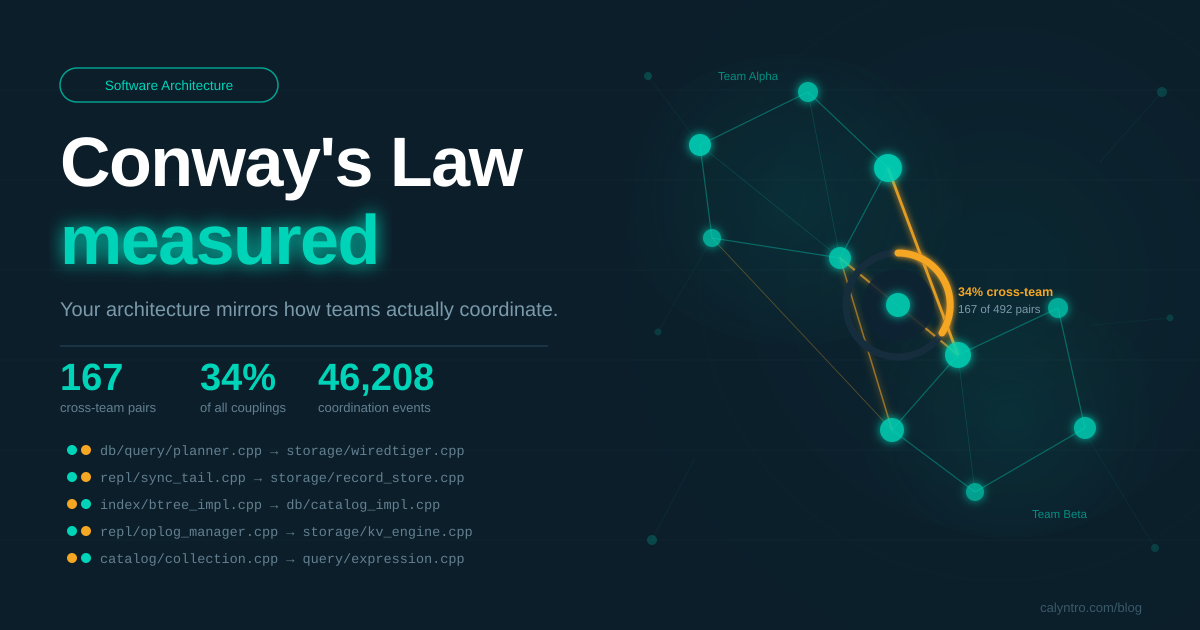
- 492 coupled module pairs were detected across the repository
- 167 of those (34%) crossed simulated team boundaries — Conway’s Law violations by the structure we assigned
- 46,208 coordination events were logged where a cross-team change triggered a follow-on change in another team’s module
- Directional asymmetry was clearly visible: a subset of cross-team pairs showed strong one-directional coupling, where one module consistently drove changes in the other
The patterns that emerged were structurally coherent. Modules with strong directional coupling across team boundaries were the ones where, in a real organization, you’d expect engineering leads to be having recurring conversations about “why does every change in X require a change in Y?”
That conversation is expensive. It usually happens informally, without any record, and it doesn’t show up in sprint reviews or architecture docs. But it shows up in your commit history — if you look.
You can explore the full MongoDB analysis at demo.calyntro.com — no login required.
What This Looks Like in Practice
In a real organization — one with actual team structures, not simulated ones — this analysis answers a set of questions that are otherwise surprisingly hard to answer:
Which modules create invisible coordination overhead between teams?
Not the dependencies that are formally documented and managed, but the ones that emerge organically from the way the work gets done. The ones where a change in team A’s module silently requires someone from team B to follow up.
Does your architecture reflect how your teams actually work — or how they’re supposed to work?
Org charts and architecture diagrams describe intention. Commit history describes reality. The gap between the two is where Conway’s Law lives.
Where should you draw harder boundaries?
When two modules belonging to different teams have strong, directional, high-frequency coupling, that’s a signal that a formal API boundary is needed. Not as a bureaucratic constraint — but because the coupling already exists, and making it explicit reduces the coordination cost.
Is a planned reorganization going to make things better or worse?
Before restructuring teams, you can look at the current coupling patterns and reason about which new structure would align with them — or which modules would need to be refactored to make a new structure viable.
Why Git History, Not Dependency Analysis
Static dependency analysis tells you what the code imports. That’s useful, but it misses a lot.
Git history tells you what the code needs to change together in practice. That captures implicit dependencies that no linter or static analysis tool can see: shared data contracts, configuration coupling, behavioral assumptions that are tested together even when they’re not linked in the import graph.
The signal is also inherently organizational. A static dependency between two modules tells you about the code. A co-change pattern between two modules tells you about the people — about who coordinates with whom, how often, and in which direction.
That’s the Conway’s Law signal. And it’s been accumulating in your repository since the first commit.
Try It on Your Own Repository
The MongoDB analysis is a demonstration. The more interesting question is what the same analysis would show on your codebase — with your real team structure, your actual modules, your commit history.
Calyntro is self-hosted. Your repository data doesn’t leave your infrastructure. You import your own Git history, define your team structure, and Calyntro does the rest.
→ demo.calyntro.com — live MongoDB analysis, no login → calyntro.com — documentation
Conway’s Law isn’t a warning. It’s a measurement opportunity. Your Git history is already telling you how your teams actually coordinate. The question is whether you’re reading it.
Live Demo
Curious what this looks like in practice?
The full analysis runs live against the MongoDB open-source repository — no login, no setup required.
Want to See This for Your Codebase?
If you’re curious what coupling patterns look like in your repository — with your team structure, your modules, your history — I’m happy to walk through it together.
No commitment, no sales pitch. Just a focused look at your Git data and what it says about how your teams actually coordinate.
Or reach out directly: khreichel@calyntro.com
I’ll prepare a short analysis of a public repository in your tech stack before the call — so we’re looking at real patterns from the first minute.