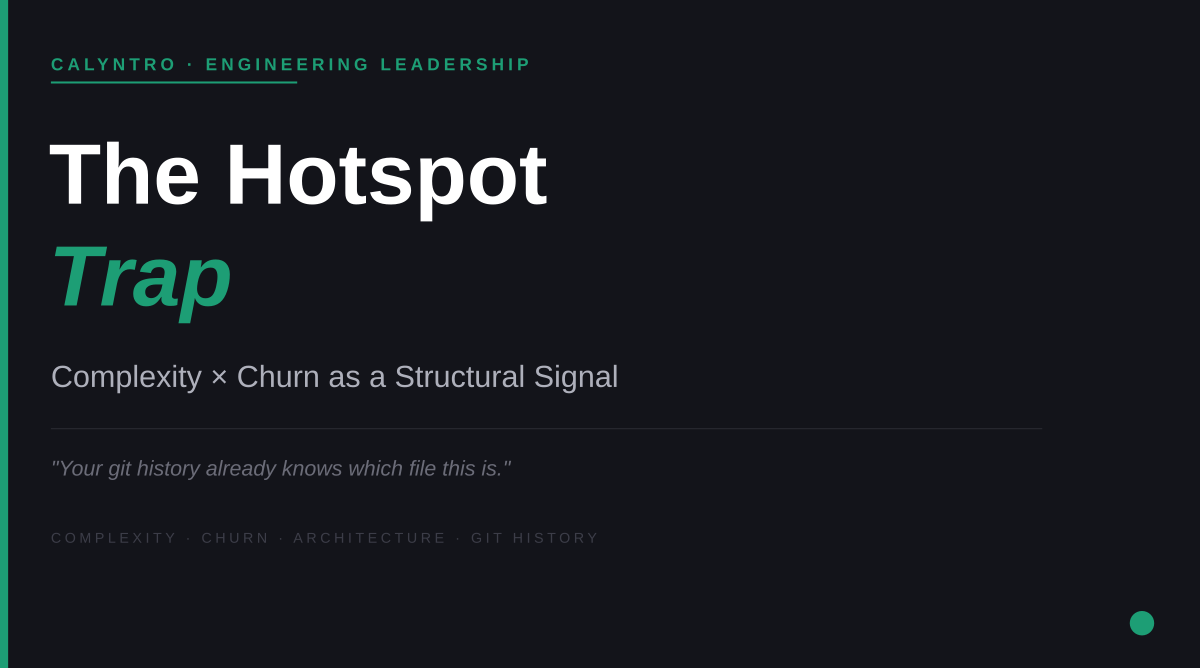
The Hotspot Trap: Complexity × Churn as a Structural Signal

The Hotspot Trap: Complexity × Churn as a Structural Signal

There is a file in the MongoDB codebase that has been touched 62 times in the last year. It is 2,273 lines long. Its cyclomatic complexity is 926 — in a codebase where the average is 53. replication_coordinator_impl.cpp Every engineer who has worked near the replication layer knows it. The name alone is enough to produce a familiar reaction: a slight tension, a quick mental calculation of whether the ticket they just picked up is going to touch it. ...
July 22, 2026 · 5 min · Karl-Heinz Reichel
Knowledge Risk — from metric to recommended action

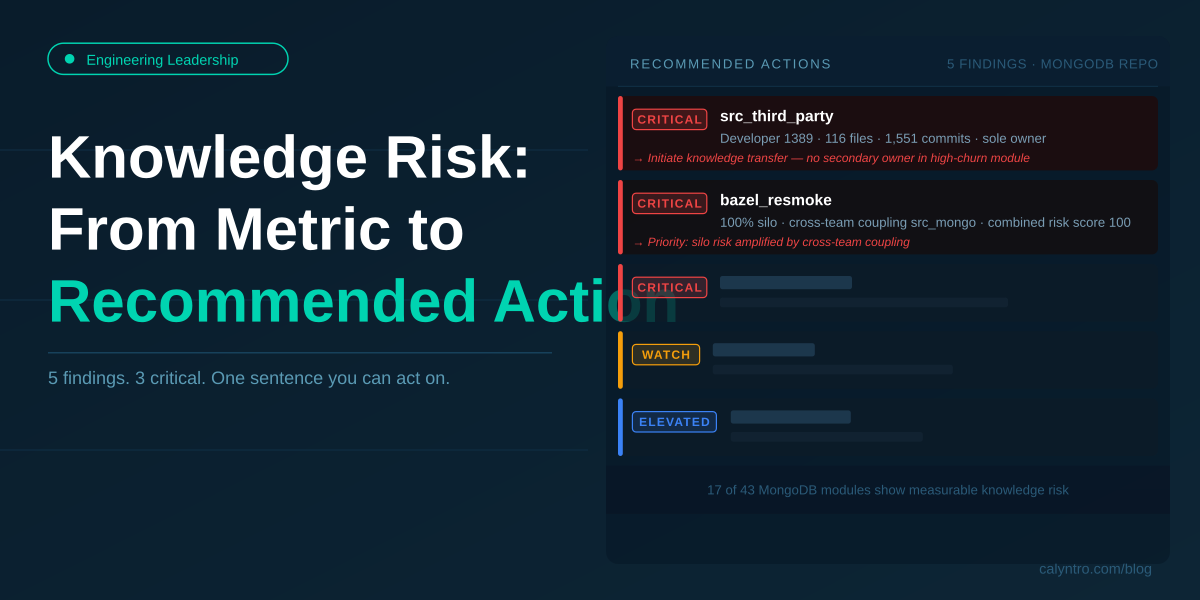
Knowledge Risk: From Metric to Recommended Action

Most tools that measure bus factor stop at the number. One person owns this module. Here is the percentage. Good luck. That’s useful context. It’s not useful guidance. The question a CTO or engineering manager actually needs answered isn’t how concentrated is the knowledge? — it’s what do I do about it, and where do I start? The Problem With Raw Risk Metrics Knowledge concentration exists in virtually every codebase. Run any ownership analysis on a real production repository and you’ll find modules where one person did 80% of the meaningful work. You’ll find files nobody else has touched in two years. You’ll find developers who accumulated knowledge across hundreds of commits that isn’t written down anywhere. ...

June 16, 2026 · 3 min · Karl-Heinz Reichel
Was Ihre Git-Historie über Ihr Team verrät — und warum kaum jemand hinschaut

Was Ihre Git-Historie über Ihr Team verrät — und warum kaum jemand hinschaut

Ein Team plant eine größere Umstrukturierung. Drei Module sollen einem neuen Team übergeben werden, zwei weitere zusammengeführt. Der Engineering Manager ist zuversichtlich — die Architektur ist klar dokumentiert, die Übergabe sollte in zwei Sprints erledigt sein. Vier Monate später ist das Projekt noch nicht abgeschlossen. Was niemand vorher gesehen hatte: Eines der übergebenen Module hatte in den letzten 18 Monaten exklusiv einen einzigen Entwickler als Ansprechpartner — der inzwischen das Unternehmen verlassen hatte. Ein anderes Modulpaar änderte sich faktisch immer gemeinsam, obwohl im Architekturdiagramm keine Verbindung eingezeichnet war. Und ein dritter Bereich zeigte seit Monaten stetig steigende Komplexität — unbemerkt, weil niemand den Trend über Sprints hinweg verfolgt hatte. ...

June 7, 2026 · 5 min · Karl-Heinz Reichel
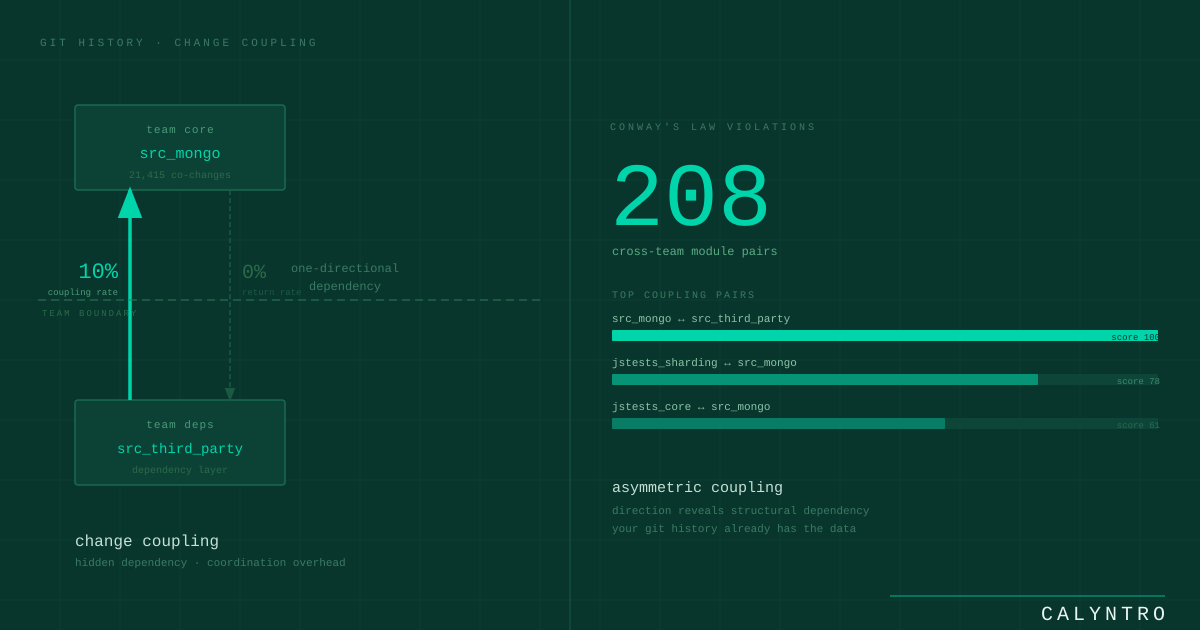
Change Coupling — Conway's Law violations visible in Git history

Change Coupling: How Git History Reveals Conway's Law Violations

Your architecture diagram shows what your system is supposed to look like. Your Git history shows what it actually does. Those two things are rarely identical. What Change Coupling Is Change coupling measures how often two modules change in the same commit — without any static code analysis, without reading a single line of source code. Just commit metadata and file paths. If module A and module B consistently appear together in commits, something connects them. Maybe it’s a shared interface. Maybe it’s a hidden dependency. Maybe it’s one team doing the work of two. Whatever the reason, the Git history captures it. ...

June 3, 2026 · 3 min · Karl-Heinz Reichel
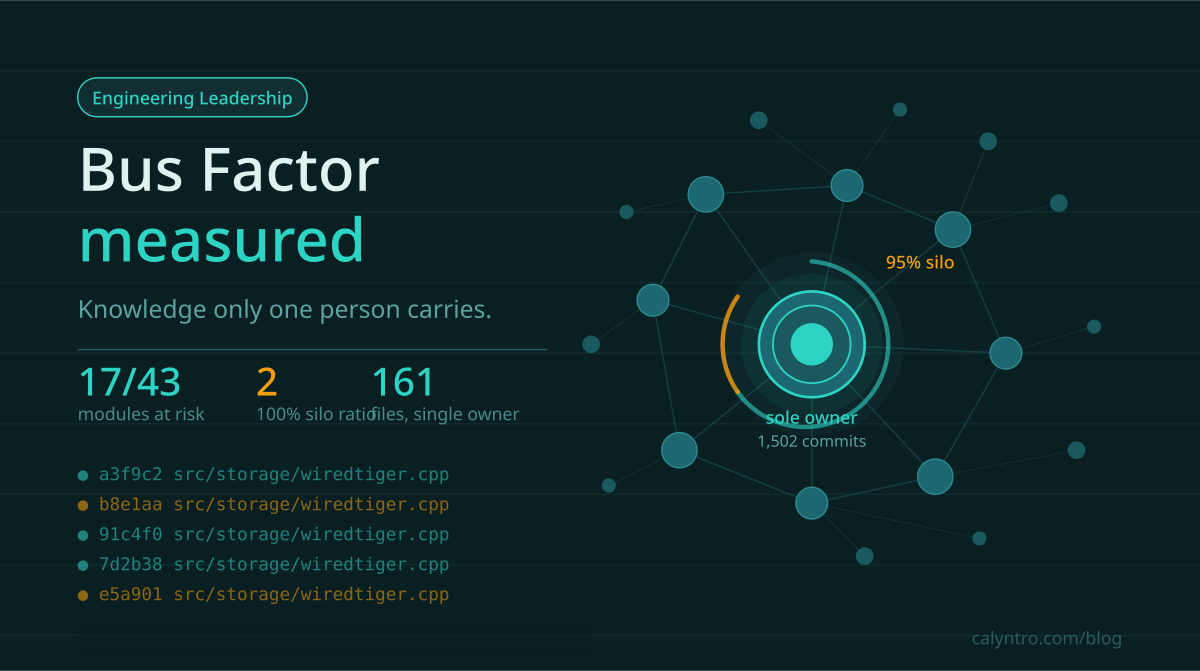
How to measure bus factor in your software team

How to Measure Bus Factor in Your Software Team

Bus factor is one of those concepts every engineering leader nods at and almost nobody measures. The definition is simple: how many people would need to leave — or get hit by a bus — before your project is in serious trouble? A bus factor of 1 means a single person holds knowledge that no one else has. If they leave, you’re exposed. Most teams estimate this. They name names. They have informal conversations about who knows which system. And then they file it away until someone actually leaves. ...

June 2, 2026 · 6 min · Karl-Heinz Reichel